The Real-Time Lane: A Base Silver Layer for Snowplow on Snowflake
Dedupe and remove bots within minutes of collection, feed the newsroom directly, and let Silver and Gold run on their own schedule.
 Nitin Jain
This is the last post in our Snowplow series. The first three covered the architecture, the Snowplow dbt packages and the Gold star schema. All of that runs in batches: every hour, every few hours, or overnight. That is fine for finance and product teams. It is not fine for a newsroom.
On a recent project for a large digital publisher with several news brands, web and mobile apps, editors wanted to see what readers were doing right now: which stories are climbing, which push alert landed, whether a homepage change moved traffic. They needed numbers within a few minutes, and they needed those numbers to be clean. Duplicate events and bot traffic make a real-time chart lie just as easily as a monthly report.
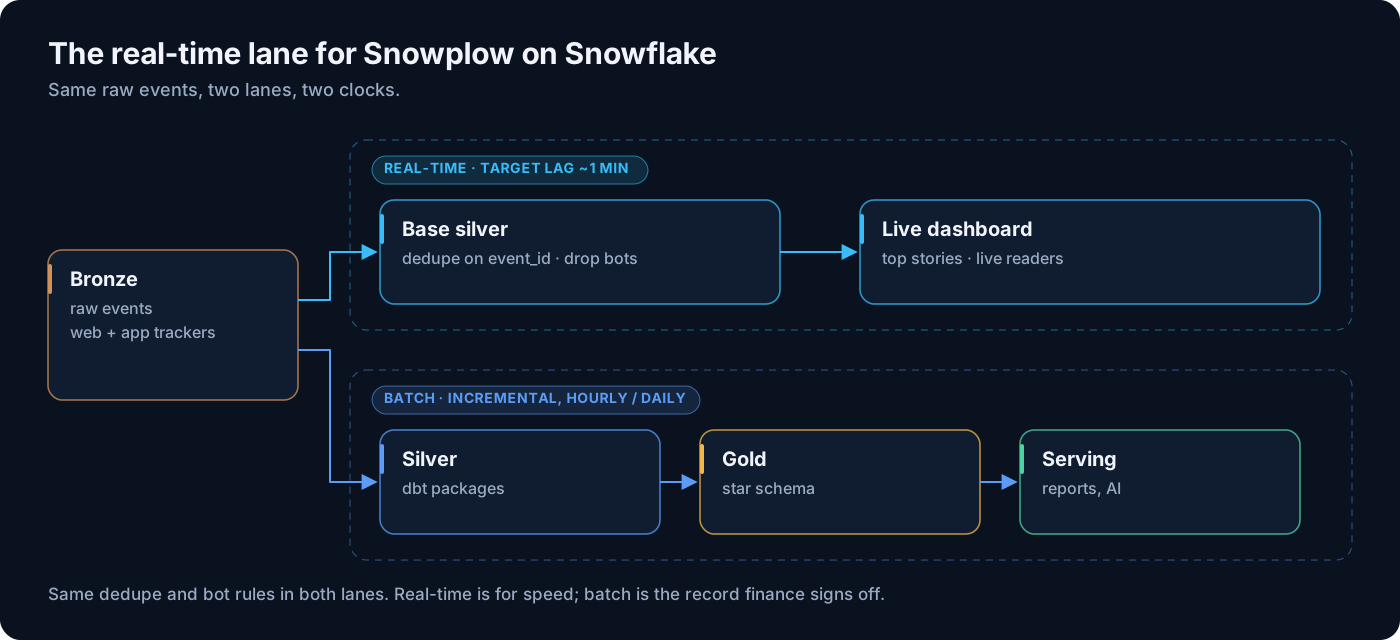
Our answer was a second lane. A small base silver layer dedupes events and removes bots minutes after they land in Snowflake. The newsroom dashboard reads from it directly. The Snowplow dbt packages and the Gold star schema keep running incrementally on their own schedule, and they do not wait for it or depend on it.
Why the newsroom gets its own lane
The obvious idea is to run the whole dbt project every five minutes. We tried the numbers and dropped it. On each run the unified package reprocesses sessions with new events inside a lookback window and rebuilds views, sessions and users, and Gold builds on top. That is right for an analytics model, but far too much to repeat every few minutes, and a run that overruns blocks the next one.
The newsroom also does not need sessions, users or a star schema. It needs a short list of questions answered fast: page views per article in the last 30 minutes, active readers by brand and platform, traffic by referrer. Those come straight from cleaned events. So we split the work:
- Real-time lane: Bronze events → base silver (deduped, bot-filtered, a few columns, a rolling window of recent days) → newsroom dashboard. Freshness target: a few minutes.
- Batch lane: Bronze events → Snowplow unified package (Silver) → Gold facts and dimensions → aggregates and serving views. Freshness target: hourly or daily, depending on the consumer.
The two lanes read the same Bronze table and apply the same rules for duplicates and bots. They will still not match to the last event at any given moment, because they run at different times. We wrote that down for the newsroom on day one: the real-time view is for direction and speed, and the batch numbers are the record.
What base silver does, and what it does not
Keep this layer small. Every extra column and join adds refresh time, and refresh time is what you pay for. Ours does four things:
- Dedupes on
event_id. Snowplow delivers events at least once, so the sameevent_idcan land more than once. We keep one row perevent_id, the earliest bycollector_tstamp. - Removes bots. With the IAB Spiders & Robots enrichment switched on, each event carries an entity with a
spiderOrRobotflag. We drop events where it is true. You can add a user-agent rule of your own, but keep it in one place so both lanes use it. - Keeps a rolling window. Only events collected in the last few days. The newsroom does not look further back, and a short window keeps every refresh small.
- Selects only the columns the dashboard uses. Event ID, timestamps,
app_id, event name, page URL and title, referrer, a content ID if the tracker sends one, and the user and session identifiers.
It does not build sessions, stitch users, join to dimensions or compute engaged time. Those belong to the batch lane.
The SQL: a dynamic table with QUALIFY
Here is a simplified version of the table as a Snowflake dynamic table. Table names and the three-day window are sample values. The column for the IAB entity follows the Snowflake loader’s naming for entities (contexts_<vendor>_<name>_<major version>), stored as an array.
sqlCREATE OR REPLACE DYNAMIC TABLE analytics.base_silver.events_rt
  TARGET_LAG   = '1 minute'
  WAREHOUSE    = rt_wh
  REFRESH_MODE = INCREMENTAL
  INITIALIZE   = ON_CREATE
AS
SELECT
    e.event_id,
    e.collector_tstamp,
    e.derived_tstamp,
    e.app_id,                     -- e.g. brand_a-web, brand_b-ios-app
    e.event_name,
    e.page_urlhost,
    e.page_urlpath,
    e.page_title,
    e.refr_medium,
    e.refr_source,
    e.domain_userid,
    e.domain_sessionid
FROM raw.snowplow.events AS e
WHERE e.collector_tstamp >= DATEADD(day, -3, CURRENT_TIMESTAMP())
  AND e.event_name IN ('page_view', 'screen_view')
  AND COALESCE(
        e.contexts_com_iab_snowplow_spiders_and_robots_1[0]:spiderOrRobot::boolean,
        FALSE
      ) = FALSE
QUALIFY ROW_NUMBER() OVER (
    PARTITION BY e.event_id
    ORDER BY e.collector_tstamp, e.etl_tstamp
) = 1;
A few notes on why it looks like this:
REFRESH_MODE = INCREMENTALmakes creation fail if Snowflake cannot refresh the query incrementally. We prefer that toAUTO, which can quietly fall back to a full refresh. A full refresh of a busy events table every minute is the bill you do not want.- Snowflake’s docs list
ROW_NUMBER()withPARTITION BYand theQUALIFYclause as supported for incremental refresh.CURRENT_TIMESTAMP()is supported only insideWHERE,HAVINGorQUALIFY, which is where our rolling window uses it. Put it in theSELECTlist and incremental refresh is off the table. - The minimum
TARGET_LAGis 60 seconds. Target lag is a goal, not a schedule: Snowflake decides when to refresh so the data is never older than the lag, as long as each refresh finishes in time. - The window filters on
collector_tstamp, the time Snowplow received the event, not on the device’s clock. That matters for late events, covered below.
Dynamic tables vs streams + tasks
Snowflake gives you two native ways to build this. A dynamic table is declarative: you write the SELECT and a target lag, and Snowflake works out the changes and the timing. Streams + tasks is the do-it-yourself route: a stream on the Bronze table tracks new rows, and a task runs a MERGE into base silver on a schedule or when the stream has data.
| Dynamic table | Streams + tasks | |
|---|---|---|
| How you write it | One SELECT. Snowflake handles change tracking and the merge. | A stream, a task and your own MERGE with its own dedupe logic. |
| Freshness control | TARGET_LAG, minimum 60 seconds. Snowflake picks refresh times. | A schedule you set, or a triggered task that runs when the stream has data (at most every 30 seconds by default, configurable down to 10). |
| Refresh mode | AUTO, INCREMENTAL, FULL (and an adaptive option). Some query shapes cannot run incrementally. | Always incremental, because you only read what the stream returns. Correctness is on you. |
| Compute | A named warehouse. If nothing upstream changed, the refresh is skipped and the warehouse stays suspended. | A named warehouse or serverless. A WHEN SYSTEM$STREAM_HAS_DATA() condition skips runs with nothing to do. |
| Late or duplicate rows | The window function re-evaluates any affected event_id for you. | Your MERGE must handle an event_id that already exists in the target. |
| Operations | Refresh history, lag and errors in one place. Fewer moving parts. | Watch the stream: if it is not consumed within the source table’s retention (extended up to 14 days by default), it goes stale and must be recreated. |
| Good fit | A clean, filter-and-dedupe transformation like this one. | Logic a dynamic table cannot express, side effects (calling procedures, alerts), or sub-minute freshness. |
For base silver we chose the dynamic table. It is a filter and a dedupe, which dynamic tables do well, and it avoids two bugs we have seen in hand-written MERGE jobs: duplicates when two batches carry the same event_id, and streams that go stale while a task sits suspended. If the newsroom ever needs freshness under a minute, triggered tasks are the tool, and we would revisit.
1-minute or 5-minute target lag?
Start with the question, not the setting. Ask the editors what decision they make with the chart and how fast they make it. For a breaking story, a minute matters. For a homepage review, five minutes is plenty.
Then look at cost. The gap between the two settings has little to do with how long each refresh takes. It comes from warehouse billing. Snowflake bills warehouses per second, with a 60-second minimum each time a warehouse resumes. A refresh that takes 5 seconds still costs a minute if the warehouse had to wake up for it.
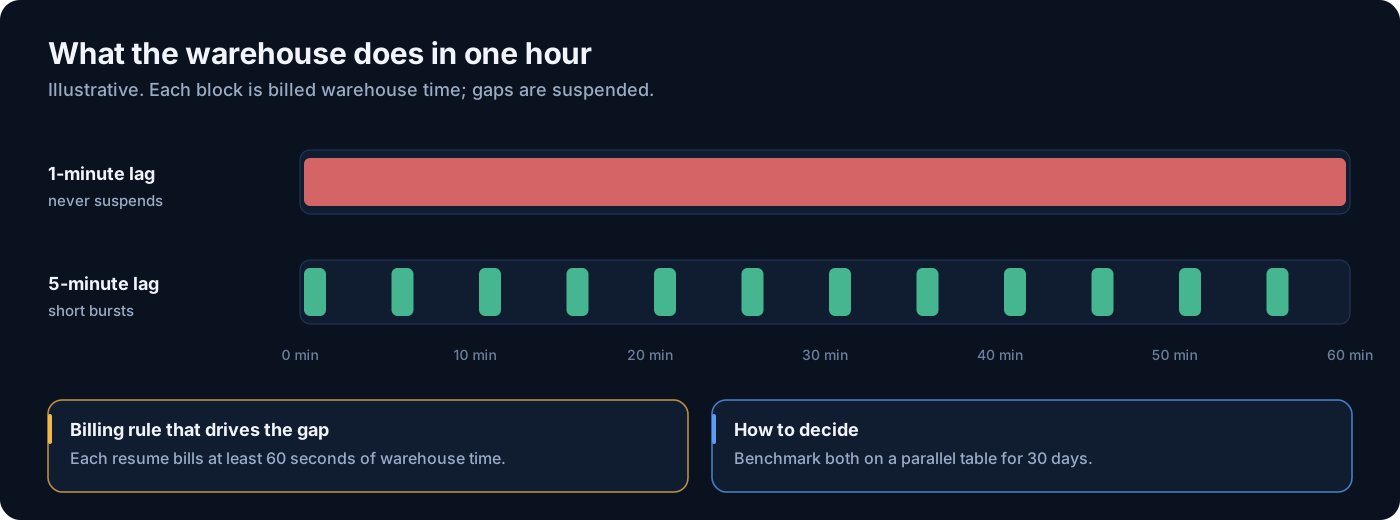
- At 1 minute, refreshes come so often that a dedicated warehouse with a 60-second auto-suspend almost never sleeps. You pay for close to 24 hours a day, however short each refresh is.
- At 5 minutes, the warehouse wakes, refreshes for a few seconds, waits out its auto-suspend and sleeps. You pay for roughly a minute and a bit out of every five.
What it costs: a method, not a number
We do not quote anyone a real-time cost before measuring it. The method is simple: credits per hour for the warehouse size × hours the warehouse is actually running. Standard warehouses double in credits per hour with each size step, so an X-Small uses 1 credit per hour and a Medium uses 4. Check the current Snowflake credit table for your account and warehouse type, and your contract for the price of a credit.
| Illustrative only | 1-minute lag | 5-minute lag |
|---|---|---|
| Warehouse | Medium (4 credits/hour) | Medium (4 credits/hour) |
| Refreshes per day | 1,440 | 288 |
| Work per refresh (sample) | 5 seconds | 10 seconds |
| Billed time per day | ~24 hours (never suspends) | 288 × ~70 s ≈ 5.6 hours |
| Credits per day | ~96 | ~22 |
| Same on an X-Small (1 credit/hour) | ~24 | ~6 |
These figures are made up to show the arithmetic. They assume a dedicated warehouse with a 60-second auto-suspend and ignore cloud services credits, which dynamic tables use for change detection on every cycle, even when nothing changed. The shape is what matters: at 1 minute you are buying an always-on warehouse, so you want the smallest one that keeps up. At 5 minutes, warehouse size matters less than the minimum billing.
At a 1-minute lag the question is not “how long does a refresh take?” but “what is the smallest warehouse that never falls behind?”
Benchmark before you switch
Do not change the production table and watch the bill. Build a parallel one and measure it. This is the plan we use:
- Build a parallel table with the candidate definition, for example
events_rt_bench, next to the current one. Point nothing at it. - Give it its own warehouse. Start on a Medium so you measure the work, not queueing behind other jobs. A dedicated warehouse also makes the metering clean.
- Use 30 days of data. A quiet Tuesday tells you nothing. Thirty days covers weekends, a big news day and any backfill or reprocessing that lands in Bronze. If your rolling window is shorter, replay the 30 days through it rather than testing on one day.
- Run each cadence for long enough to see peaks: 1 minute for a stretch, then 5 minutes, same warehouse, same definition.
- Measure four things: refresh duration (p50 and p95), how often actual lag went over target, credits from warehouse metering history, and row counts against the batch lane for the same hours (duplicates and bots removed should match).
- Right-size, then switch. If p95 refresh time is a small fraction of the lag, step the warehouse down and run again. Move the dashboard only when the smaller size holds at peak.
Late-arriving events
Mobile apps buffer events. A reader opens an article on a plane, the app stores the events, and sends them when the phone reconnects, hours or days later. Snowplow keeps several timestamps for this: dvce_created_tstamp (device clock at the event), dvce_sent_tstamp (device clock at send), collector_tstamp (when the collector received it) and derived_tstamp, which corrects the device time for clock skew.
Each lane has to decide what to do with them:
- Base silver filters on
collector_tstamp. A late event arrives “now”, so it falls inside the rolling window and is deduped and bot-checked like any other. Nothing is lost at this stage. - The newsroom chart has to pick a clock. If it buckets by
derived_tstamp, a late event lands in a bucket from yesterday, and the last 30 minutes are always slightly undercounted until stragglers arrive. If it buckets bycollector_tstamp, the chart shows arrivals, which can spike when a batch of phones reconnects. We bucket byderived_tstampand drop events older than the chart’s window, so a two-day-old view never shows up as a new one. - The batch lane uses lookback windows. The Snowplow unified package re-reads a window before its last processed event (
snowplow__lookback_window_hours, default 6) to catch out-of-order events. It also drops events whose device sent them more thansnowplow__days_late_alloweddays after creating them (default 3). If your apps buffer for longer, raise it, or accept that those events exist in Bronze but not in Silver.
Measure it: count Bronze events by the gap between dvce_created_tstamp and collector_tstamp, per platform. In our sample data, web was almost all under a minute and the apps had a tail of a few days. That tail sets both the base silver window and snowplow__days_late_allowed.
Running it day to day
- Alert on lag, not just failures. A dynamic table that keeps refreshing but falls behind its target is a failure for the newsroom. Snowflake records refresh history and lag; alert when actual lag exceeds target for more than a few cycles.
- Keep the bot and dedupe rules in one place. If the batch lane changes its bot rule, the real-time lane must change with it, or the two will drift and someone will ask which number is right.
- Reconcile daily. Compare yesterday’s page views by brand in base silver against the batch lane. A small, steady gap is expected from timing. A sudden jump means a rule changed or a refresh fell back to full.
That closes the series. Bronze holds everything. A small base silver lane gives the newsroom clean numbers in minutes. The Snowplow packages build Silver, and Gold turns it into a star schema the rest of the business can trust. Each layer has one job and its own clock, which is what keeps the whole thing affordable.
Planning a real-time layer on Snowflake?
We help teams decide what needs to be real-time, benchmark dynamic tables against streams + tasks on their own data, and size the warehouse before the bill arrives. Talk to us about your Snowplow or event data platform.
Frequently Asked Questions
What is a base silver layer?
A thin layer between raw events (Bronze) and the modelled Silver tables. It dedupes events on event_id, removes bot traffic and keeps a few recent days of data, refreshed within minutes so real-time dashboards can read it directly.
Should I use a dynamic table or streams + tasks for real-time Snowplow data?
For a filter-and-dedupe transformation, a dynamic table is simpler to build and run: you write one SELECT and a target lag, and Snowflake handles change tracking. Streams + tasks fit better when you need logic a dynamic table cannot express, side effects, or freshness under the 60-second minimum target lag.
Is a 1-minute target lag much more expensive than 5 minutes?
Usually yes, and not only by the number of refreshes. Warehouses bill a 60-second minimum each time they resume, so at a 1-minute lag a dedicated warehouse rarely suspends. Estimate cost as credits per hour for the warehouse size times hours running, then confirm it with a benchmark on your own data.
How do late-arriving mobile events affect a real-time dashboard?
If the base layer filters on collector_tstamp, late events are kept and cleaned like any other. The dashboard must then pick a clock: bucketing by derived_tstamp puts late events in the past, bucketing by collector_tstamp shows arrivals. In the batch lane, the Snowplow package uses a lookback window and a days-late limit to handle them.
Why not just run the Snowplow dbt package every few minutes?
The unified package rebuilds sessions and users within a lookback window on each run, and Gold builds on top of that. That is too much work to repeat every few minutes, and runs that overrun block the next one. A separate small real-time layer is cheaper and more predictable.
Need help building your data platform?
At CData Consulting, we design, build, and operate modern data infrastructure for companies across North America. Whether you are planning a migration, optimizing costs, or building from scratch — let's talk.
Get data engineering insights delivered to your inbox
Join our newsletter for weekly insights on Snowflake, data architecture, and modern analytics.